Have a shortcut to my BD-PROCHOT software tools - if this is what you're after, anyway.
PC hardware since about Pentium M "Banias", if not sooner, is capable of EIST.
Saving power by fiddling with frequencies and voltages.
Even before EIST, there was probably the HLT instruction, which already allowed
for some "awake state CPU power saving" (not sure if the CPU's of that era actually
took the opportunity).
And, modern CPU's are known to use emergency "clock throttling" when the
temperature grows past some limit.
And, there's TurboBoost - there have been several generations of this.
Plus some further minor buzzwords.
And then you have the ACPI Sleep states of the whole system, and more buzzwords...
I've come across all this while researching an inexplicable throttling problem in a particular PC system in our lab, and I was restricted to Windows.
I kept asking myself questions such as "is there a system to all this power saving madness? An official taxonomy? Any gages to watch? Knobs to tweak? Particular ways to stress the system to reproduce the problem? How do I go about debugging this? Are there any common pitfals?"
Several weeks down the road, I cannot say I'm all the wiser, let alone on top of the whole thing... but it does feel like I do have a semi-complete picture now, which is worth exposing to the wild wild web - the sort of a writeup that I've been missing while collecting information.
The problem that I was facing, in practical PC hardware,
turned out to be a known bug in the Haswell CPU. I.e., problem solved.
Which does not deter me at all from publishing this "compendium" :-)
This page has been compiled based on personal study of several online sources:
StackExchange/SuperUser topics, the ACPI spec, Microsoft and Intel self-help websites,
Intel datasheets and errata and misc other websites... see the references.
Along with practical hands-on exercise using software tools,
some of which I've written myselfs.
Solid information is difficult to come by. Any corrections / hints / updates are warmly welcome :-)
This whole topic is formalized and categorized into a few
opaque dry buzzwords, that tend to be used against you,
the seeker of help and truth, by authoritative documentation
(Intel, Microsoft, ACPI). The documentation available is either
superficial and incomplete, or deeper but extremely extensive and complex
(while, apparently, not giving the whole picture still).
And then you try to debug the stuff and you're facing some
user interfaces offered by Windows, which upon closer inspection
feel quite detached from what's actually going on under the hood.
So anyway let's start with some superficial buzzwords :-) First a list of the several WHEE-states:
Interestingly, the P-/C-/T-states are not mutually dependent / interrelated. Imagine them "orthogonal". Yes indeed, the CPU can enter the deepest C-state (sleep) while clocked at the highest frequency (P-state). And if emergency throttling (T-state) gets engaged, it is likely to happen at times of high load = at a higher-performing P-state = high CPU clock rate.
The various power states are formalized in ACPI/UEFI specs (see the references). The ACPI/UEFI definitions are not an exact match to register-level docs on Intel CPU hardware, and both sides keep evolving through the years... And the topic borders on Windows power policies/profiles - which is yet another story with own vocabulary and semantics.
Let's take a more detailed look at the four categories of whee-states.
Imagine this as a vector of [frequency ; voltage]. A CPU capable of EIST and Turbo
can have twenty or more of these "performance levels".
The frequencies are stepped along integer multiples of the external reference clock
(such as: 100 MHz) and the corresponding voltages are nowadays provided by the CPU
internally... The modern CPU's even speak about "performance percentages",
rather than a clock multiplier. As part of the gradual evolution, where the frequency
or P-state used to be governed by the OS, in modern CPU generations this is steered
autonomously by the CPU itself, merely getting an indication from the OS on what
performance level is desired. A milestone in this vein appears to be the Skylake family
(6th generation Intel Core) and the relevant keyword appears to be
HWP = Hardware-controlled Performance States and to be honest,
the story has been unfolding further... (HDC, RAPL and whatnot).
For instance in a Haswell (= "4th-gen Core"), apparently the performance control
was still more on the software side. Exactly how this responsibility is shared between
the OS ("OSPM") and the BIOS (UEFI), that's a good question.
ACPI/UEFI come in a row of different versions, so do Windows...
P-states are said to be defined in the ACPI tables (FADT?) using objects called _PSS.
In the hardware, there's a programming interface in the form of
IA32_PERF_CTL and IA32_PERF_STATUS MSR's.
In the days of early EIST, until maybe Core 2 Duo, the IA32_PERF_CTL
was used to directly configure the multiplier and the desired voltage (VID code).
Later, apparently starting from Nehalem, the ability to affect voltage has vanished
(steered autonomously by the CPU) and the multiplier has turned into
a "desired performance level" (still with some relationship to the actual multipler).
With later CPU generations, the control over P-states (including Turbo)
has moved further into the CPU's own responsibility (autonomous HW-based
steering - getting more fine-grained, per core, optimized etc).
There are also bitwise configuration flags, allowing you to enable/disable
"EIST Hardware Coordination", "Intel Dynamic Acceleration",
TurboBoost and EIST as a whole - see the MSR_MISC_PWR_MGMT, IA32_PERF_CTL
and IA32_MISC_ENABLE registers. And there's a new MSR called IA32_HWP_CAPABILITIES,
related to the HWP (Skylake+)...
For the core voltage steering to operate, the CPU needs to indicate the desired level to the VRM - which is traditionally onboard, but has moved on chip in some CPU models... The CPU traditionally had a couple pins called VID, which formed a parallel binary code, turned into a VRM voltage reference by a simple DAC in the onboard VRM... later this VID code got a serial bus (Serial VID or SVID). The CPU comes with a factory start-up VID, which later changes when the power management engages. Up until approx. Core 2 Duo, the VID pins would reflect whatever VID code was written into the IA32_PERF_CTL MSR. Modern CPU's don't have this immediate interface anymore.
To sum up, P-states govern the isochronous CPU core clock frequency
(and supply voltage, behind the scenes). Per CPU package, or per core.
The "servo loop" controlling P-states (power and voltage) responds relatively slowly,
compared to C-state transitions (CPU naps, see the next bullet). Also, the overall "bias" of the
P-state governance, called a "power profile", appears to have quite some say over the
minimal or maximal P-state practically achievable. The power profile is something
operated by the OS when deciding what P-state to ask for - but apparently the
BIOS does something similar, in the absence of a modern OS, and possibly on modern
CPU's, it's the CPU hardware heeding the one configured profile (the OS no longer
can indicate the P-state desired).
Namely the power-saving and high-performance Power Profiles are rather unwilling,
in practice, to transition with the current P-state away from the indicated bias.
The balanced profile is... kinda what it says on the tin.
Now: so far we've been talking about the classic P-states, pretty much overlapping
with the buzzword EIST. There is quite a bit of register-level compatibility across
the CPU generations, and the EIST range is pretty much where you can ask explicitly
for a particular P-state.
But, that's not all. On top of that, there is Turbo Boost - which is more dependent
on the CPU's whim, and can raise the CPU core frequency further above the plain EIST
maximum. The CPU notices immediate load, and can speed up all the cores together a bit,
or a single core even somewhat more. Which makes the behavior of the P-states overall pretty enigmatic :-)
In the P-state / EIST parlance, a particular CPU model has a few characteristc frequencies,
corresponding to integer multipliers of the reference "base frequency". Examples:
| CPU model | Core i5-5020U | i7-4650U | i5-4440S |
| Max Turbo single-core | N/A | 3300 | 3300 |
| Max Turbo multi-core | N/A | 2900 | 3200/3000/2900 |
| EIST max | 2200 | 2300 | 2800? |
| CPU nominal | 2200 | 1700 | 2800 |
| EIST min | 500 | 800 | 800 |
The taxonomy of the various frequencies is a little tangled. For instance, "base frequency" may be used to refer to the "EIST maximum" above (e.g. in the Windows Task Manager), or it can also mean the reference clock of the multiplier, i.e. 100 MHz-ish (called "base clock" by several other tools). You can find detailed examples in the screenshots of software tools below, in the chapters on Windows and Linux configuration/debugging.
This is basically synonymous with "CPU sleep state". Independent of the current frequency, the program code running on a CPU core often reaches a point where it has nothing to do, "until something happens" (until an interrupt comes). These idle moments at the code level can be really short, not worth switching gears to another frequency - yet worth taking a nap to save power. A modern x86 CPU has two instructions to ask for a sleep state: HLT and MWAIT. In a multitasking OS, these get called exclusively by the CPU scheduler, when it has no more processes in the active/running state. Using an argument to the MWAIT, the OS process scheduler can require explicitly, a sleep state that it deems appropriate - and the CPU hardware may obey that wish, or may "demote" the state to a shallower sleep state...
To sum up: regardless of the currently selected P-state (clock frequency), the CPU takes ultra-short naps, whenever an opportunity arises.
It can also take a deeper nap, turning off more circuitry, e.g. flushing and turning off caches, to save more power - which takes longer to enter and leave.
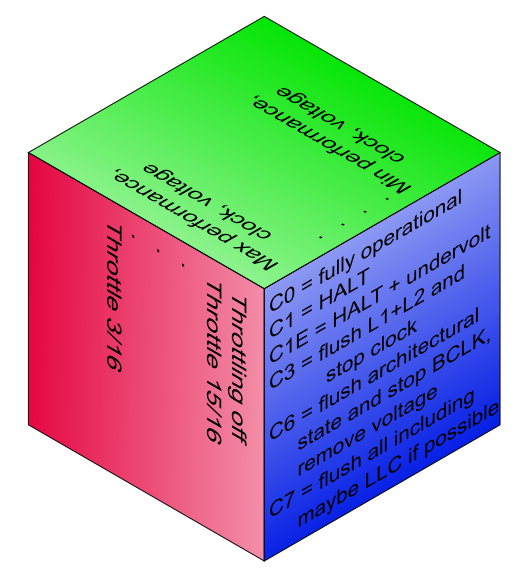
In the C-state taxonomy:
C0 = fully active state (running, executing)
C1/C1E = light sleep with inexpensive entry and wakeup
further popular CPU sleep states are C3, C6 and C7. The higher the number, the deeper the sleep.
In ACPI tables, the C-states are supposedly defined by _CST objects.
At the HW level, there's a MSR called MSR_PKG_CST_CONFIG_CONTROL, which allows one to specify the deepest C-state allowed (and has a lock bit which tends to be set by the BIOS during POST). Interestingly, the Intel datasheet says that this MSR is not related to the CPU core C-states as requested by the MWAIT instruction... go figure.
Some use cases, namely gaming and audio processing, are badly impacted
by the lengthy wakeups from C3/C6/C7 - these kinds of users prefer
to disable the deep sleeping. Hence the BIOS options to do so
and hence third-party tools such as ParkControl.
Another load pattern that suffers from C-states, especially the deeper ones,
is networking applications. Running a server or a firewall.
Unless the machine is heavily loaded, the CPU tends to take naps.
And in that case, upon every packet, it has to exit the C-state first,
before it can handle the request (and fall asleep again). Now imagine
a sequence of such latencies - in a network topology consisting of
several machines, or even within a single OS image, where the app
is multi-threaded and the threads keep passing request to each other.
What hurts are the "wake-up latencies", ranging from just a couple CPU clock cycles for the shallow C1, to several hundred microseconds for the C6/C7.
Note that we're still talking about per-core CPU sleep states that happen while the OS is "perfectly awake and running" to an outside observer. Do not confuse the CPU C-states with system-wide ACPI S3/S4 (suspend to RAM and hibernate) where the OS and system as a whole goes to sleep, shuts down user interfaces, filesystems, networking etc.
CPU clock throttling (gating, PWM style). This appears to be a worst-case countermeasure, for disastrous circumstances (overheating), used "when all else fails". Unlike P-states, where the isochronous frequency is shifted up or down, with T-states, there's an 8-level (3bit) counter and comparator (or 16-level=4bit, in the enhanced version) that can suppress a given number of clock edges, out of every 8 or 16, from reaching the CPU core. I.e., the CPU core inserts say 5 "wait states" every 8 clock ticks. This decreases heat production, as it saves a tiny bit of switching loss, for every skipped clock tick, throughout the CPU die.
In the ACPI tables, the T-states are supposedly defined using an object called _TSS.
The interface to the CPU T-states (aka "clock modulation") has evolved throughtout the CPU generations. In general, it can be invoked by a hardware signal called PROCHOT, or by a direct programming request via the IA32_CLOCK_MODULATION MSR, and apparently, modern autonomous power management has other ways and reasons to invoke throttling (without giving much in the way of a warning or explanation). Hints about overheat status (immediate and sticky/logged) are available from several MSR's: the good old IA32_PACKAGE_THERM_STATUS, IA32_THERM_STATUS, and the more modern MSR_CORE_PERF_LIMIT_REASONS, MSR_GRAPHICS_PERF_LIMIT_REASONS and MSR_RING_PERF_LIMIT_REASONS.
On a CPU whose temperature is safely below the overheat threshold, T-states should never occur (unless mistakenly engaged by a software bug). Yet, to dispute a particular source, T-states are not yet irrelevant. Especially in modern notebook PC's, characteristic by sloppy thermal design, they're all too relevant even with the 11th-gen Intel CPU's shipping in volume at the time of this writing.
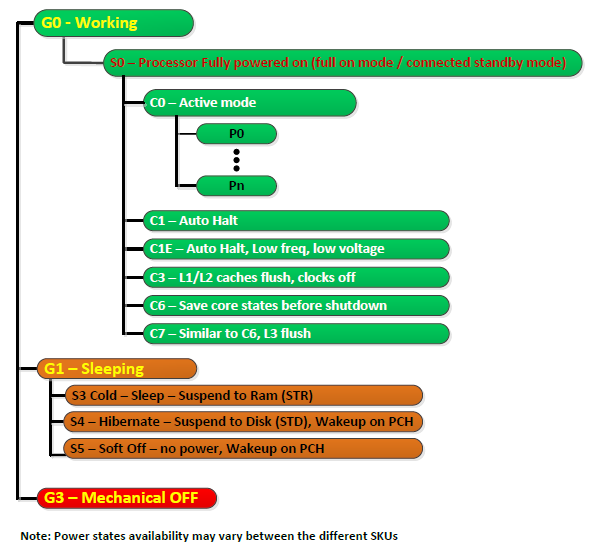
ACPI S-states refer to the whole computer, including peripherals and the power supply. The CPU and OS is only alive and interactive in the S0 state. Other popular ACPI States are S3 = suspend to RAM, S4 = suspend to disk (OS image can be restored to the last running state) and S5 = soft power off (the OS has carried out a graceful shutdown). ACPI also defines S1 = "sleepwalking", a really shallow stand-by state, on the desktop hardly distinguishable from "screen blanked to save power". The S1 is nowadays hardly ever implemented in practical PC hardware, because it offers no advantages (power savings) over a nominal S0 spiced with CPU C-states and moderate peripheral power saving measures (display off, disks spun down).
Some diagrams taken from Intel datasheets follow below:
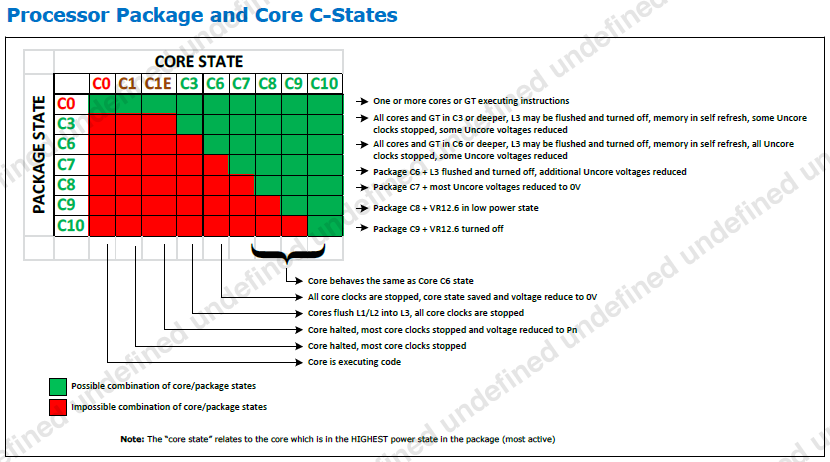
The package as a whole, the IGP and misc "un-core" logic, and the CPU cores themselves, are governed by a hierarchy of power "states", broadly speaking. The following picture comes from an Intel Datasheet and lists C-states, framed by the system-global ACPI states (S-states).
If you're looking for P-states and T-states, these are not mentioned in the picture above.
The matrix below lists core C-states and package C-states - depicts their legal combinations.
The concepts, objects and terminology about Power Management are different between the hardware, the BIOS(/UEFI) and the OS. And, different OS'es have different frameworks and concepts to control the power management - with just the vague greater picture bearing some resemblance.
If you are here to disable the darn C-states, you should first try to do that via the BIOS setup. This way is OS-independent. If the BIOS SETUP doesn't have an option for C-states, or you have other reasons to handle that in the OS, by all means read on :-)
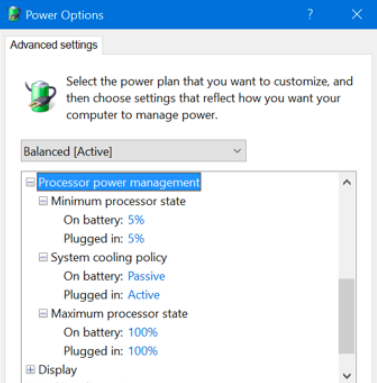
Before "tiles", Windows used to have the control panel called "Power options", where you can select a "power plan" and tweak its detailed settings. The modern GUI may eventually come up with its own "modern" dialog...
Windows come with three predefined plans:
| Plan name | CPU min %perf | CPU max %perf |
| Power Saver | 5% | 75% |
| Balanced | 5% | 100% |
| High Performance | 100% | 100% |
There are several other settings, but most of them address ACPI sleeping,
inactivity timeouts for display and HDD and whatnot.
Note that the "power plans" (profiles) may have other internal
parameters that cannot be edited via the GUI (= canned = implicit).
Such as, apparently, the eagerness to adapt the clock according to load fluctuations.
If you don't want to fiddle with the stock power plans,
it's actually possible to create a custom power plan... in the GUI. And there's
also a related command-line tool called powercfg, a stock part of Windows,
that apparently can tweak some "hidden" options of any power plan.
Unclewebb (the author of ThrottleStop)
mentions
"powercfg attributes" called IDLE_PROMOTE and IDLE_DEMOTE - which, if configured both at 100, disable C-states.
Elsewhere, I've seen a hint that a particular value of HKLM\System\CurrentControlSet\Control\Processor\Capabilities
is capable of curbing the C-states too. (This advice may be out of date though.)
(Have I already advised you to check the C-states in the BIOS SETUP?
That's your low hanging fruit, if you are here primarily for the C-states.)
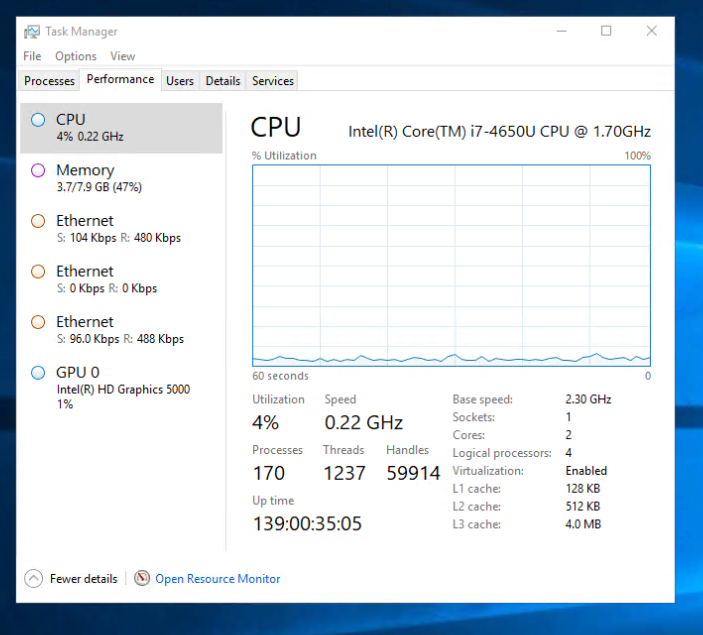
If you're interested to learn about the "current status" of CPU power saving, i.e. P-states and C-states, there's not much to learn in stock Windows. In the Task Manager, there's a single aggregate number, purported to be a frequency in GHz.
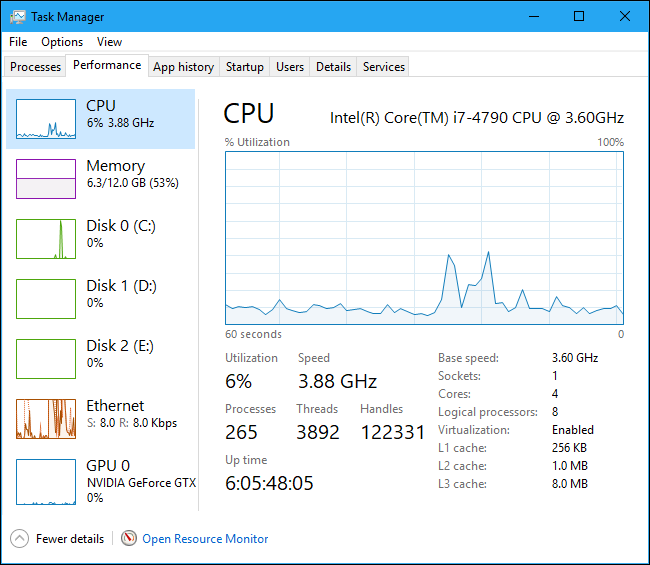
This "GHz" figure is not per core, even though individual cores do get clocked individually, and can get individually "parked" = kept in deeper C-states for extended periods of time... And, it does reflect throttling (T-state).
If I should turn this into a math formula:
the per-core actual clock frequencies (stemming from the P-state)
get multiplied by the per-core T-state PWM duty cycle,
get averaged across cores, and turned into a percentage (0-100%).
That percentage probably gets multiplied by the "base frequency"
(the base freq gets mentioned in the Task Manager / Performance),
resulting finally in that aggregate GHz number.
All in all, this "frequency" is a very synthetic number, with a vague relationship to the actual clock rates of the individual CPU cores.
In the last sketch above, notice how the current "Speed" is higher than the nominal "base speed". This is Turbo at work for you. Note how the CPU is nearly idle, yet Turbo is active. Among the stock "power plans", this behavior is only possible with the High Performance plan. The Power Saver and Balanced plans tend to trawl the rock bottom of the frequency range.
If you observe a "clock rate" below the EIST bottom, it is a clear indication
that the CPU is being throttled for some reason. The CPU clock is being PWM-gated.
Windows get the input for this "clock rate" from some Performance Monitoring MSR (in the CPU hardware).
There's a T-state active, either explicitly, or implicitly.
The T-state can be entered on demand by software, or it can be a result
of the PROCHOT signal getting activated - typically due to overheating or due to
power supply problems. Or, it can also be a CPU bug (a known erratum on the Haswell).
If you see a CPU frequency that's equal to the EIST bottom, that alone does not mean a problem. This is harmless. It merely means, that the CPU doesn't have much to do, therefore it's "idling at low RPM" to save power. This is based on the settings of the "power plan" currently active.
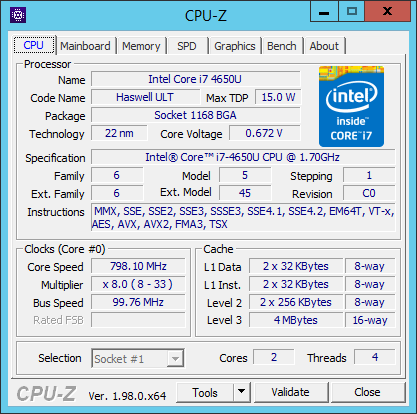
If you're interested about further details, there are 3rd-party tools to tell you the apparent reference clock, and a range of multipliers, and the approximate instantaneous frequency, per core. Let me name a few of those tools:
CPU-Z [ download ] - not very detailed about the clocking stuff, but fair enough, and does have the key basic info.
HWiNFO [ homepage ] is another option, which I haven't tested...
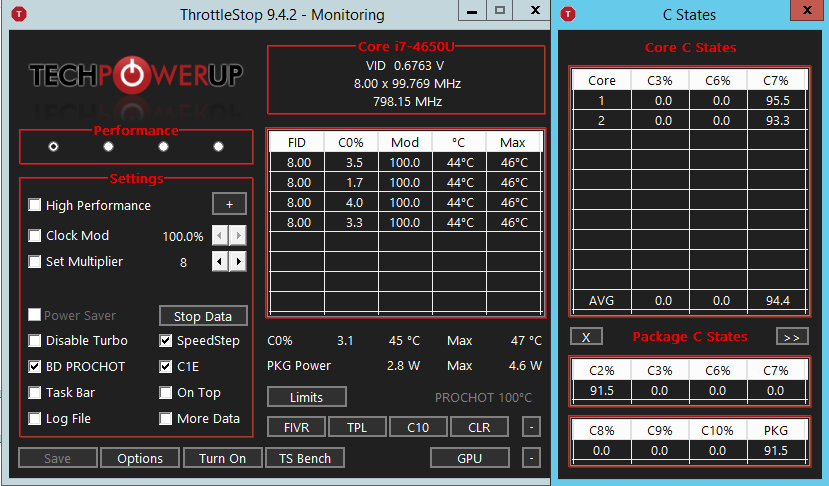
ThrottleStop [ download ] is pretty detailed about the clocks and sleep-states per core. Possibly the most detailed tool for this area, available for Windows - counter-suggestions warmly welcome :-) I've seen it cause some BSOD's on my particular system, but ahh well. The following two screenshots show ThrottleStop with C-states enabled vs. disabled in the BIOS. The values are "curious", but I'll dedicate a paragraph to the actual results somewhere further below. Note that the version of ThrottleStop that I was using did not have a column to show time percentage spent in C1/C1e. Hmm.
ThrottleStop with C-states enabled in the BIOS:
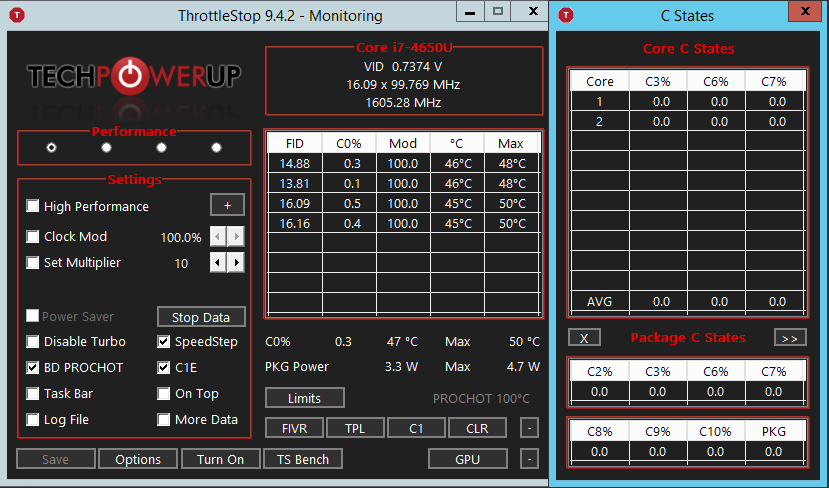
ThrottleStop with C-states disabled in the BIOS:
The original purpose of ThrottleStop was probably to have direct access to the "clock modulation" hardware interface, and possibly to mute the PROCHOT signal - if there is reason to believe, that the PROCHOT gets triggered for no good reason (= a countermeasure to a benign HW bug).
ParkControl [ homepage ] is another tool that can fiddle with C-states in Windows. Apparently, Core Parking is synonymous to the C6 power state. And, this is probably the C-state that ParkControl is aiming at. It appears to work by modifying existing Power Plans, or adding a power plan of its own... I haven't tested this tool, check it out for yourself.
BD-PROCHOT [ dedicated webpage ] is my own package of command-line tools, including an optional service, that can make sure that the BD-PROCHOT is disabled. The other tools can check some interesting MSR's that could signal a reason for mysterious throttling, can invoke or stop a throttling state, and can perform some other tricks with the MSR's in general.
While trying to corner that weird throttling quirk, I was looking for a way to read the "Task manager's GHz figure" somehow programmatically. So that I'd be able to trace it and react upon its departure into lala land.
Turns out that this is almost possible. Windows have a set (tree) of so-called "performance counters". Some of these apparently reflect the performance-related MSR's of the CPU, but not only. The Windows performance variables cover a broad range of "topics under the hood", and while most of those variables are pretty static and many of them are dummies, there are grains of gold in that haystack.
Windows contain a command-line util called Typeperf.
Invoke with -qx arg to get a full listing of performance counters.
Note: the listing is huge.
Perhaps redirect its output into a file. From there,
you can enjoy some detective work, trying to find a particular
counter that would be of interest to you.
Except, perhaps there's a better way. Read on.
Somewhat curiously to me, the stock Windows SNMP Agent doesn't have
a MIB for the performance counters.
From the vendor of the culprit PC machine, I had a proprietary subagent,
which does show the CPU frequency, but that's the static nominal value
= hardly any practical use.
That's where I came across snmptools.
A flexible 3rd-party SNMP subagent, with a special affection for the
Windows performance counters.
The snmptools download contains a command-line util called perf32.exe,
which appears somewhat more practical compared to the typeperf -qx.
Perf32 allows you to browse just a particular branch of the system-wide
tree of counters. And, there's also a batch file called
list_all_counters.bat - guess what that one does :-)
Related to that "synthetic GHz figure", the promising counter is called "\Processor Information(Total)\% Processor Performance". The total is a global figure. Per-CPU-core values are availale as well.
Let me quote some listings of "objects" and "entries" (counters)
obtained using perf32.exe of snmptools, on my random machine with a quad-core Haswell:
Objects = the top-level categories / folders
Processor
Processor Information
Processor Performance
Note how the per-core entries are indexed by a trailing number (0 to 3)
and there also tends to be a global entry tagged "_Total".
Some are in fact "double indexed"... a possible challenge
if you try to massage that into SNMP via SNMP Tools.
A note on localization: "Typeperf -qx" seems to suggest
that the names of the counters are "localized" = translated
to the native human language configured for the logged-in desktop.
Oopsie, my desktops are running in a non-English locale.
Fortunately my production machines are configured for U.S. English.
Still something to watch out for.
Apparently, some of the national characters cause indigestion
to the perf32.exe of SNMP Tools :-(
I've gone so far as to weave my own .INI file for snmptools,
containing some interesting performance counter entries,
and a corresponding MIB file.
If interested,
here you are my own re-package of Erwan Labalec's SNMP tools,
including my .INI and my .MIB file, and maybe some .CMD scripts to install/uninstall SNMP tools.
If I recall correctly, I gave up double indexing in the MIB (ASN.1), the MIB is a quick and dirty job.
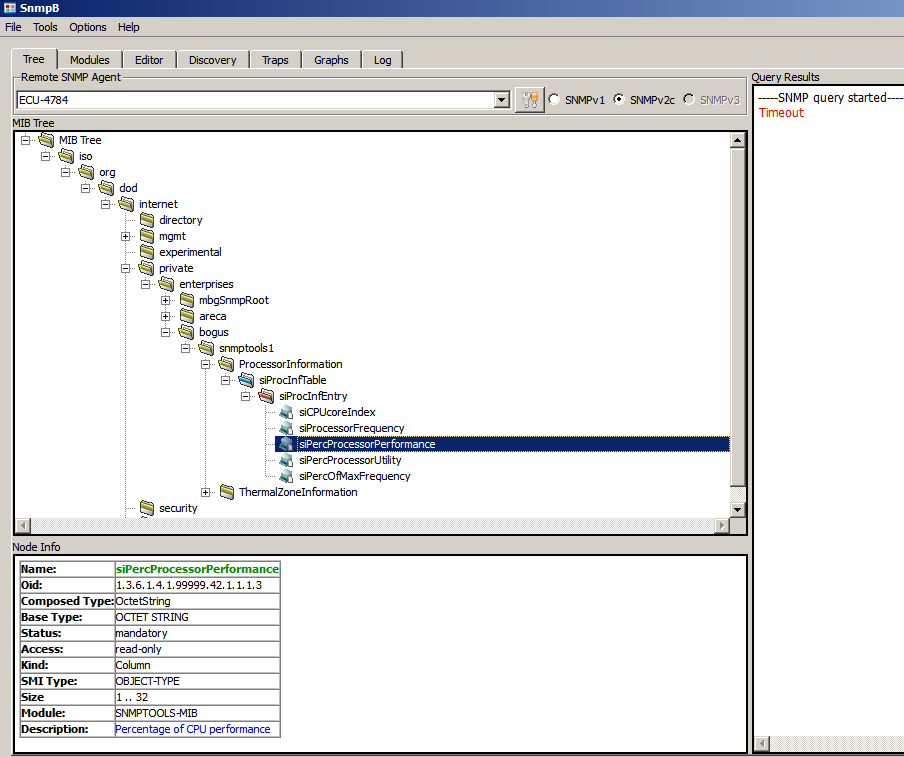
A screenshot of SNMPb with the example MIB loaded
More detailed information about the Windows SNMP Service and SNMPb can be found in our Areca SNMP howto.
(Have I already advised you to check the C-states in the BIOS SETUP? That's your low hanging fruit, if you are here primarily for the C-states.)
In Linux, the admin has a somewhat finer control over the P-states and C-states.
There's a classic Kernel command line option (that goes into your boot loader) intel_idle.max_cstate=1 . This prevents the system from ever taking deeper naps than C1. It is, first and foremost, a popular remedy to a known stability problem in the BayTrail ATOM, which would occasionally freeze when exiting a deeper C-state (namely its IGP was to blame).
The Linux kernel docs contain several chapters regarding the power management drivers.
Both the P-states and C-states drivers seem to be compiled
in the kernel strictly monolithically, i.e. they don't have the
form of .ko loadable modules, i.e. you won't find them in lsmod
nor under /lib/modules/.
The only evidence of their presence can be found in the
sysfs interface and maybe a few
brief occurences in dmesg.
C-states:
P-states:
Let me start with a quote from the cpufreq docs:
"The Linux kernel supports CPU performance scaling by means of the CPUFreq (CPU Frequency scaling) subsystem that consists of three layers of code: the core, scaling governors and scaling drivers."
C-states = lucid naps:
/sys/devices/system/cpu/cpu*/cpuidle/state*/usage
/sys/devices/system/cpu/cpu*/cpuidle/state*/name
P-states = frequencies:
/sys/devices/system/cpu/cpu0/cpufreq/scaling_driver
/sys/devices/system/cpu/cpu0/cpufreq/scaling_governor
/sys/devices/system/cpu/cpu0/cpufreq/scaling_cur_freq
/sys/devices/system/cpu/cpu*/cpufreq/stats/time_in_state
Distroes tend to contain a program called cpupower (Debian package name linux-cpupower).
Also has a GUI interface called cpupower-gui - which displays pretty much the same,
just in a GTK grid.
And, there's the turbostat, another program in the package linux-cpupower.
root@tincan:~# cpupower frequency-info
analyzing CPU 0:
  driver: acpi-cpufreq
  CPUs which run at the same hardware frequency: 0
  CPUs which need to have their frequency coordinated by software: 0
  maximum transition latency: 160 us
  hardware limits: 1.20 GHz - 2.60 GHz
  available frequency steps:  2.60 GHz, 2.00 GHz, 1.60 GHz, 1.20 GHz
  available cpufreq governors: performance schedutil
  current policy: frequency should be within 1.20 GHz and 2.60 GHz.
                  The governor "schedutil" may decide which speed to use
                  within this range.
  current CPU frequency: Unable to call hardware
  current CPU frequency: 2.16 GHz (asserted by call to kernel)
  boost state support:
    Supported: no
    Active: no


root@tincan:~# cpupower idle-info
CPUidle driver: acpi_idle
CPUidle governor: menu
analyzing CPU 0:

Number of idle states: 2
Available idle states: POLL C1
POLL:
Flags/Description: CPUIDLE CORE POLL IDLE
Latency: 0
Usage: 9806
Duration: 1924292
C1:
Flags/Description: ACPI HLT
Latency: 0
Usage: 668013667
Duration: 2941793155247
One noteworthy feature of turbostat is the listing of CPU-specific MSR's in the extended "debug" listing, such as MSR_CORE_PERF_LIMIT_REASONS. This can come in handy in situations, where the CPU is behaving weird, throttling for no apparent reason or some such. Note that not all the MSR's are present in all CPU models. That is why they're called Model Specific Registers :-)
root@tincan:~# turbostat --debug
turbostat version 20.09.30 - Len Brown <lenb@kernel.org>
cpu 0 pkg 0 die 0 node 0 lnode 0 core 0 thread 0
cpu 1 pkg 0 die 0 node 0 lnode 0 core 1 thread 0
CPUID(0): GenuineIntel 0xd CPUID levels; 0x80000008 xlevels; family:model:stepping 0x6:17:a (6:23:10)
CPUID(1): SSE3 MONITOR - EIST TM2 TSC MSR ACPI-TM HT TM
CPUID(6): APERF, No-TURBO, DTS, No-PTM, No-HWP, No-HWPnotify, No-HWPwindow, No-HWPepp, No-HWPpkg, No-EPB
cpu1: MSR_IA32_MISC_ENABLE: 0x4062872489 (TCC EIST MWAIT PREFETCH No-TURBO)
CPUID(7): No-SGX
/dev/cpu_dma_latency: 2000000000 usec (default)
current_driver: acpi_idle
current_governor: menu
current_governor_ro: menu
cpu1: POLL: CPUIDLE CORE POLL IDLE
cpu1: C1: ACPI HLT
cpu1: cpufreq driver: acpi-cpufreq
cpu1: cpufreq governor: schedutil
cpu0: Guessing tjMax 100 C, Please use -T to specify
cpu0: MSR_IA32_THERM_STATUS: 0x883a0000 (42 C +/- 1)
cpu0: MSR_IA32_THERM_INTERRUPT: 0x00000003 (100 C, 100 C)
cpu1: MSR_IA32_THERM_STATUS: 0x88410000 (35 C +/- 1)
cpu1: MSR_IA32_THERM_INTERRUPT: 0x00000003 (100 C, 100 C)
cpu1: BIOS BUG: apic 0x1 x2apic 0x0
usec    Time_Of_Day_Seconds     Core    CPU     APIC    X2APIC  Avg_MHz Busy%   Bzy_MHz TSC_MHz IRQ     POLL    C1      POLL%   C1%     CoreTmp
  331   1692710146.527651       -       -       -       -       311     25.24   1232    2600    29505   1       21383   0.00    78.81   42
  163   1692710146.527483       0       0       0       0       337     27.31   1234    2600    14175   0       10071   0.00    78.66   42
  138   1692710146.527651       1       1       1       0       285     23.17   1228    2600    15330   1       11312   0.00    78.95   35
^C SIGINT

# This output comes from the turbostat manpage:
turbostat version 4.1 10-Feb, 2015 - Len Brown <lenb@kernel.org>
       CPUID(0): GenuineIntel 13 CPUID levels; family:model:stepping 0x6:3c:3 (6:60:3)
       CPUID(6): APERF, DTS, PTM, EPB
       RAPL: 3121 sec. Joule Counter Range, at 84 Watts
       cpu0: MSR_NHM_PLATFORM_INFO: 0x80838f3012300
       8 * 100 = 800 MHz max efficiency
       35 * 100 = 3500 MHz TSC frequency
       cpu0: MSR_IA32_POWER_CTL: 0x0004005d (C1E auto-promotion: DISabled)
       cpu0: MSR_NHM_SNB_PKG_CST_CFG_CTL: 0x1e000400 (UNdemote-C3, UNdemote-C1, demote-C3, demote-C1, UNlocked: pkg-cstate-limit=0: pc0)
       cpu0: MSR_NHM_TURBO_RATIO_LIMIT: 0x25262727
       37 * 100 = 3700 MHz max turbo 4 active cores
       38 * 100 = 3800 MHz max turbo 3 active cores
       39 * 100 = 3900 MHz max turbo 2 active cores
       39 * 100 = 3900 MHz max turbo 1 active cores
       cpu0: MSR_IA32_ENERGY_PERF_BIAS: 0x00000006 (balanced)
       cpu0: MSR_CORE_PERF_LIMIT_REASONS, 0x31200000 (Active: ) (Logged: Auto-HWP, Amps, MultiCoreTurbo, Transitions, )
       cpu0: MSR_GFX_PERF_LIMIT_REASONS, 0x00000000 (Active: ) (Logged: )
       cpu0: MSR_RING_PERF_LIMIT_REASONS, 0x0d000000 (Active: ) (Logged: Amps, PkgPwrL1, PkgPwrL2, )
       cpu0: MSR_RAPL_POWER_UNIT: 0x000a0e03 (0.125000 Watts, 0.000061 Joules, 0.000977 sec.)
       cpu0: MSR_PKG_POWER_INFO: 0x000002a0 (84 W TDP, RAPL 0 - 0 W, 0.000000 sec.)
       cpu0: MSR_PKG_POWER_LIMIT: 0x428348001a82a0 (UNlocked)
       cpu0: PKG Limit #1: ENabled (84.000000 Watts, 8.000000 sec, clamp DISabled)
       cpu0: PKG Limit #2: ENabled (105.000000 Watts, 0.002441* sec, clamp DISabled)
       cpu0: MSR_PP0_POLICY: 0
       cpu0: MSR_PP0_POWER_LIMIT: 0x00000000 (UNlocked)

              0       0       4    0.11    3894    3498       0   99.89    0.00    0.00    0.00      47      47   21.62   13.74    0.00
              0       4    3897   99.98    3898    3498       0    0.02
              1       1       7    0.17    3887    3498       0    0.04    0.00    0.00   99.79      32
              1       5       0    0.00    3885    3498       0    0.21
              2       2      29    0.76    3895    3498       0    0.10    0.01    0.01   99.13      32
              2       6       2    0.06    3896    3498       0    0.80
              3       3       1    0.02    3832    3498       0    0.03    0.00    0.00   99.95      28
              3       7       0    0.00    3879    3498       0    0.04
If you'd appreciate a user-friendly view of the current P-state (CPU frequency) and the C-state usage stats, consider using the following:
CoreFreq [ download ]
is probably the sexiest piece of software in this vein in Linux.
Detailed, and open source.
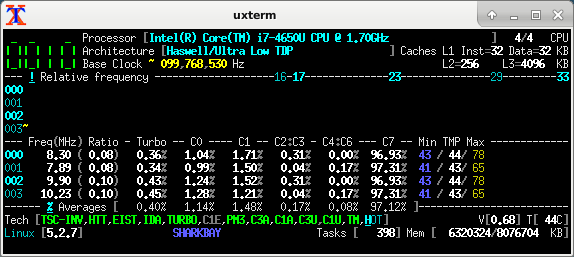
CoreFreq in its default "frequency" TUI screen
appears to show CPU "frequency" (load, rather) multiplied by the percentage
of time spent in C0. The column is tagged by the MHz unit, but the values at "near idle"
are just too low for the CPU cores to be clocked that low.
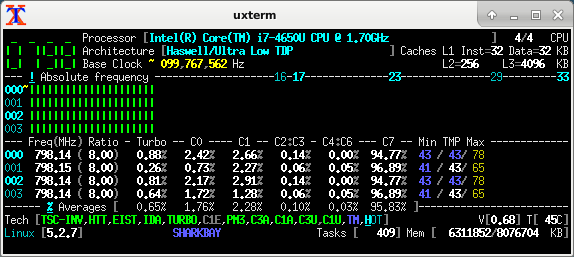
It took me a while to find out that I need to use a sweet command-line arg
(-Oa -t frequency) to get corefreq-cli to show the actual frequencies
and not factor in the active time percentage.
Corefreq also has a downside: it depends on a kernel module = you need to recompile corefreq if you replace (upgrade) the kernel.
CoreFreq with "relative" frequencies (= not really frequencies):
CoreFreq with proper "absolute" frequencies:
Information that you can see across all the tools, and that is specific to a particular CPU model:
- the reference / base clock, here it's 100 MHz (this is what gets multiplied)
- basic EIST range (without Turbo), here it's 800 to 2300 MHz, i.e. multiplied 8x to 23x
- single-core Turbo, here it can stretch the clock up to 3.3 GHz, i.e. multiplied 33x (2.9 GHz = 29x multi-core turbo)
The "nominal marketing frequency" of 1700 MHz does appear to have some substance though: one of the tools calls it the "default" frequency - i.e. probably the frequency that the CPU wakes up with on power-up, before the BIOS-driven power management kicks in.
The following is the first few lines from a dump of corefreq-cli -s
Processor                             [Intel(R) Core(TM) i7-4650U CPU @ 1.70GHz]
|- Architecture                                          [Haswell/Ultra Low TDP]
|- Vendor ID                                                      [GenuineIntel]
|- Microcode                                                        [0x00000016]
|- Signature                                                           [  06_45]
|- Stepping                                                            [      1]
|- Online CPU                                                          [  4/  4]
|- Base Clock                                                          [ 99.768]
|- Frequency            (MHz)                      Ratio
                 Min    798.15                    <   8 >
                 Max   2294.67                    <  23 >
|- Factory                                                             [100.000]
                       1700                       [  17 ]
|- Performance
   |- P-State
                 TGT    798.15                    <   8 >
|- Turbo Boost                                                         [ UNLOCK]
                  1C   3292.36                    <  33 >
                  2C   2893.28                    <  29 >
                  3C   2893.28                    <  29 >
                  4C   2893.28                    <  29 >
|- Uncore                                                              [   LOCK]
                 Min    798.15                    [   8 ]
                 Max   2294.67                    [  23 ]
|- TDP                                                           Level <  0:3  >
   |- Programmable                                                     [ UNLOCK]
   |- Configuration                                                    [ UNLOCK]
   |- Turbo Activation                                                 [ UNLOCK]
             Nominal   1696.06                    [  17 ]
              Level1    798.15                    [   8 ]
              Level2   2294.67                    [  23 ]
               Turbo   1596.29                    <  16 >
The listing goes on, the whole dump is over 200 rows of text.
Looking into my BIOS SETUP on a particular machine, there are three relevant options, all of them binary:
...which begs the question, to what extent the BIOS config is "carved in stone" for the OS, vs. only relevant until a proper OS starts and handles this at its own terms. Subject to a practical test. Historically, speaking of various SuperIO and Intel chipset and CPU features (HW registers and capabilities), I recall varying results. The hardware contains irreversible locks (until power-cycle) on some of its configurable features (not nearly all of them), and for those that can be locked, the BIOS may or may not actually use the lock. So I know the mileage does actually vary.
On a particular occasion, involving a particular specimen of PC hardware, I tried disabling the C-states in the BIOS, and started Linux and Windows to take a look at the practical results.
Interestingly, Linux happily idled in C6/C7 :-) Apparently the intel_idle driver ignores the BIOS setting and just uses the C-states at its own terms. On my particular system = BIOS version + CPU model.
Also interestingly, Windows do obey the BIOS setting, and avoid using C3/6/7. But, appaently, if ThrottleStop is not kidding, the CPU does keep using C1. (Curiously, ThrottleStop does not have a dedicated column for C1 in its tables of C-state usage.) So... it seems as if Windows is in touch with the BIOS power management, does follow its advice to a degree (or maybe entirely), but for some reason, the BIOS or Windows actually refrain from banning the super-light C1 as well, in spite of what that BIOS SETUP entry would appear to say.
Which is not surprising - the labels on SETUP entries can be misleading. There can be BIOS bugs - but to be fair to the vendors, the technical reality under the hood is often much too complicated, to capture in a BIOS SETUP menu entry (20 characters?) and its online help. Realistically, no system admin is humanly able to follow all the gory details of register-level chipset config, that theoretically could be exposed in the BIOS SETUP... as a result, in any given PC model, the BIOS SETUP tends to offer a select few choices in the typical areas covered, with many more register-level configs being done automagically behind the scenes, or "reasonable defaults" are used - based on the BIOS engineers' preference, the motherboard vendor's marketing dept. guidance, feedback from the customers (techsupport trouble cases), Intel's marketing pressures, actual HW features available from the particular CPU model and generation etc.
You may come across a machine that's way too slow for no apparent reason.
In the Windows task manager, you may notice an absurdly low frequency,
a fraction of the EIST minimum. This is the first clear sign that the machine
is throttling.
Further details can be obtained using ThrottleStop or my BDPROCHOT tool.
Among legitimate causes, this can be due to the CPU overheating - due to damaged thermocoupling (paste detached, heatpipe leak) or due to a deliberately lame heatspreader design.
Another spectrum of legitimate-ish causes comes from power supply or rather
battery management. Some notebooks throttle when the battery is running low
(thus making the graceful shutdown take longer = compromised innovation).
Someone has reported that in his case, replacing the notebook's external
AC/DC "power brick" solved the problem.
Or it can be some other misc bug in "motherboard design" around the CPU,
triggering the BD-PROCHOT signal. Which can be avoided (and disproved)
by switching the CPU's PROCHOT pin to ignore input.
These "legitimate" causes are especially popular in modern notebooks, but overheating can obviously also happen in a botched desktop/gaming rig.
In a particular trouble case, that has prompted me to study this whole topic and write this text, I was observing a weird symptom. The CPU "clock rate", as quoted by the Windows Task Manager, was ludicrously low. Below the "EIST bottom" (800 MHz for the CPU at hand.)
I was able to reproduce a very similar number (0.23 GHz) using my BDPROCHOT tool, by asking for a suitable P-state combined with an appropriate T-state (900 MHz * 2/8). But, in the real-world problem that was happening to me in production, this was not the case! There was no explicit T-state, and no PROCHOT activation. The IA32_CLOCK_MODULATION MSR would read 100% = no throttling. Yet the MSR_CORE_PERF_LIMIT_REASONS had the "thermal" status flag raised, for no apparent reason. Turned out to be a bug (erratum) of the Intel Haswell CPU. That particular CPU bug can be avoided if you disable C-states deeper than C1E. This rare bug occurs when waking up from the deeper C-states.
C-states have traditionally been a great no-no to people who are into real-time audio and gaming - causing stutter.
C-states can also have effects on other workloads,
where they can be more difficult to diagnose - making them
a neat trap for the unwary. The more subtle workload areas are:
networking, database apps, and general server workloads
where different threads tick in a "request - response" fashion.
I've seen this in a business app that runs a thick native Win32 client
and an IIS/ASP-based web front-end, talking to a MSSQL back-end
through a PC/Linux-based firewall. All the CPU's involved
were mostly idle, the network was mostly idle, disk drives
mostly idle, the database was loaded in RAM, and yes all the
machines had plenty enough free RAM... yet the app was slooow
and getting gradually slower with further updates
and more data in the tables. Turned out that the thick client
would open a form, that contained one large view or a table,
and a number of combo boxes tied to "codebooks" = tiny
queries into helper DB tables in the background.
For the large tables, it would use "cursor operations"
(blockwise request-response over TCP) to load the data
from the DB to the client. And, all the latencies would get
serialized, amounting to dozens of seconds when opening a form.
Simply disabling all C-states except just C1, on all the machines
involved, reduced the worst offending latencies
(when opening a DB form) down to 2-3 seconds!
You may notice a message appearing in the Windows system logs = event ID 37, "The speed of processor 0 in group 0 is being limited by system firmware. The processor has been in this state for 86400 seconds since the last report." - repeated once daily for every logical CPU core = 4 messages back to back every day, coming at the same hour and minute.
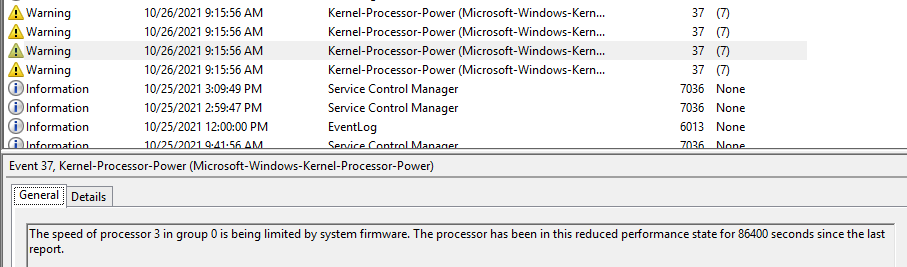
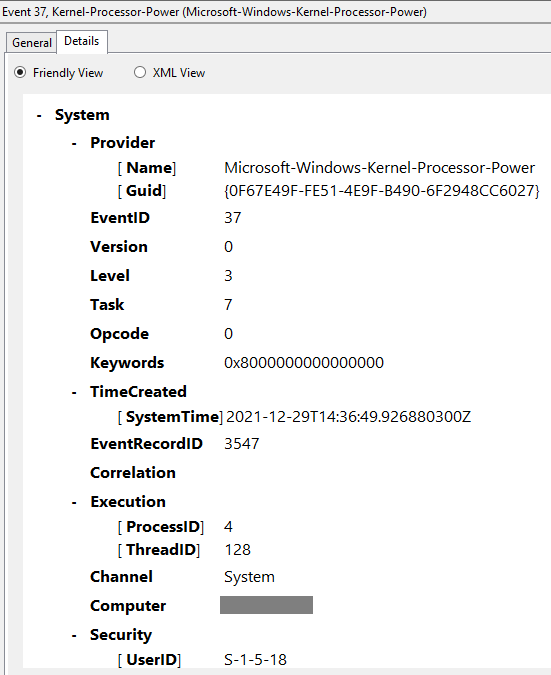
The details of the event are some Windows-internal metadata, there doesn't appear to be anything relevant to the "performance state":
While it does mean, that the CPU is running at its "rock bottom performance state" all the time,
it may as well be pretty harmless.
On my job, building PC's for use in industrial process control,
running an "embedded" edition of Windows, stripped of all unnecessary bloat
(including Antivirus software and Windows Update), I do observe this message,
if I let the machine run for days without touching it.
It just sits there idling forever, and weeps about having nothing to do into
the log every day. But if I come and pat it on the mouse, type a few keystrokes
and launch some app, the CPU frequencies rise happily for a moment,
and the message won't appear the next day at the same time.
Which means that this message alone does not prove a problem.
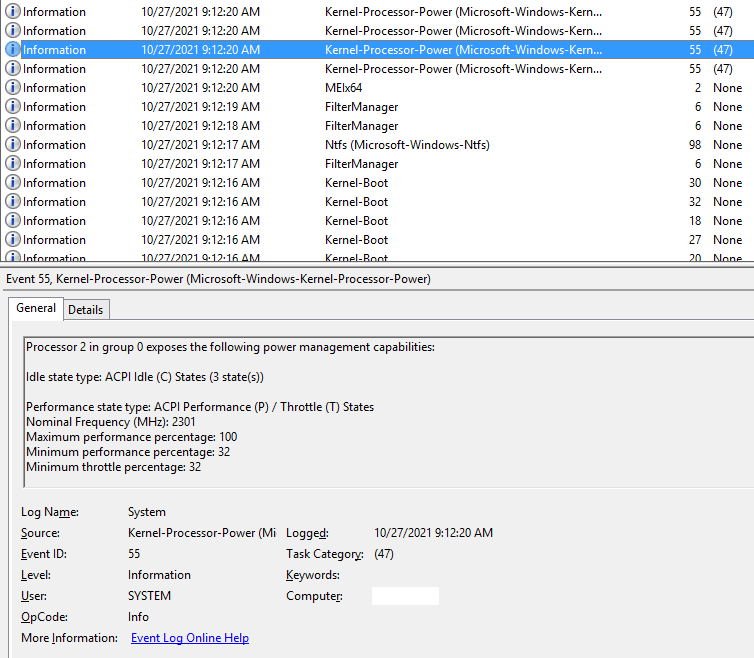
The system log actually contains another related message,
again one instance for every CPU core, but printed only once,
shortly after startup - event ID 55, "Processor 0 in group 0 exposes
the following power management capabilities:"
Nominal frequency 2301 MHz
maximum performance percentage 100
minimum perf percentage 32
minimum throttle percentage 32.
Again this does not mean a bug. It's just a startup message from the performance management subsystem. It's nice of the system to tell us those details. Perhaps the most important point here to me is, that the "processor performance" subsystem of Windows is aware of these variables and probably has a canonical API from the BIOS or HW to learn them...
Modern-day PC's contain a so-called SuperIO chip, whose traditional role is to
summarily implement some legacy PC peripherals (LPT/COM/Floppy, PS2 kb+mouse),
ATX power steering and some other glue logic + support roles.
In "mobile" platforms, the SuperIO chip integrates an extra MCU core,
used to handle additional system functions, perhaps related to battery management
and whatnot... such "SuperIO + MCU" hybrids are called the Embedded Controller
or EC for short. Open-source driver authors tend to dislike the EC
(as compared to plain SuperIO) because the EC runs proprietary firmware,
written by the motherboard manufacturer, which is often "no end of joy".
The bus connecting the SuperIO chip to the Intel or AMD chipset (south bridge)
is a narrowed-down variant of ISA, called the LPC.
Apart from all that jazz, the SuperIO/EC chip traditionally also contains a
"hardware health monitor": a block measuring various DC supply rail voltage
levels, temperatures and fan RPM's, the more modern models also being
able to steer the fans using PWM outputs.
At the dawn of time, there was a stand-alone health monitor called the LM78,
accessible only over I2C. This chip soon got integrated into LPC SuperIO,
and became alternatively accessible via an index+data port in the ISA IO space.
Many later SuperIO designs are backward-compatible with the LM78,
including its i2c access channel (which can be used for "out of band"
monitoring by an IPMI/AMT BMC, ILO, SNMP module or some such).
As part of the temperature measurement capability, the HW monitor also
has a sensor on the CPU. Historically, approximately since the era of
Pentium II, this sensor was a simple transistor, with an output pin
on the CPU package. Several generations later (since approx. Core 2 ?),
the CPU's got an integrated on-die digital sensor per CPU core,
often known as "core temp" by the name of the driver in Linux...
and apart from host-side MSR access, there is now a direct serial
digital communication channel from the CPU to the SuperIO,
handing over the digital temperature.
The modern-day SuperIO chips can steer fan RPM using PWM,
and this can be done either explicitly using host-based software,
or the SuperIO's health monitor can be configured to use an autonomous
feedback loop, based on some given parameters: temperature thresholds
and the corresponding PWM values.
This is probably nothing new - notebooks and desktops just exhibit
variable fan RPM depending on some inner temperatures,
in turn depending indirectly on CPU and system load.
During a certain era, maybe Core 2 sounds about right,
the on-CPU integrated digital sensor seemd to exhibit a significant
"pre-compensation" of the temperature readout, depending on immediate
CPU load.
Not sure if this was somehow inferred from digital activity (HLT/MWAIT?),
or current consumption, or how.
The fact was that, upon applying some number crunching activity,
the digital temperature output would jump up by 10 or 20 °C,
and after terminating the process, the temperature would drop
the same step down - immediately. The idea likely was, to have
the fan spin up ASAP, to make the feedback loop respond in a more
agile fashion (the true thermocoupling physics is very slow in comparison).
The step was so sharp that, when combined with a certain vendor/model
of a SuperIO chip, you could literally hear the fan chatter
in response to the semi-random patterns of CPU activity - almost
like EMI in a poorly shielded audio output.
Apparently, within the portfolio of Intel CPU's, "mobile" models had a steeper "precompensation" than "desktop" models. "Mobile" models including their very similar "embedded" siblings. I recall a higher-end mobile CPU, jumping up and down by 30 °C between 0 and 100% CPU load.
I also recall a trouble case where I didn't like those jumps,
and as I had the machine disassembled anyway, I decided to improve
thermocoupling of the CPU to the heatsink. I replaced the popular
thermocoupling chewing-gum with a thin layer of paste,
and did some mechanical alignments to make the CPU fit
more snugly to the heatsink.
Voila, the immediate step seemd to get less drastic, by about 10 °C.
Maybe the relative thermal inertia of the die isn't very great after all?
Relatively recent CPU's (Intel's 10th-gen core and later) are known to be very good at saving power when idle, but also steeply power hungry when subjected to processing load. Around that generation, with the Moore's law finally dead at about 10 nm, in response to competitive pressure from AMD, Intel gave up any decency as far as the meaning of TDP figures. The nominal TDP, which used to be an "absolute theoretical worst case envelope", can now be exceeded several times over. What that does with the "core temp" sensor readings and their response to a step in CPU load, is anyone's guess.
The machines suffering worst from shoddy thermals,
are traditionally notebooks. Notebook vendors have never been
ashamed to cut corners in the thermals, and the situation
overall seems to be getting worse. Why make the user drag along
kiloes of extra copper and aluminum if most of the time the machine
is just sitting idle anyway. Should the user desire to squeeze
max oomph out of the CPU, e.g. to play games or do some
compute-intensive work, ...that's hard cheese :-)
The thermal throttling (internal PROCHOT) should prevent
catastrophic damage.
As a result, PROCHOT throttling has turned into an important
everyday mechanism of thermal management in notebook PC's,
and it's not just cheap low-brand / noname models.
If your name-brand high-performance notebook tends to grind
to a crawl when you need the CPU most, well now you know why.
You can try re-seating the heatsink / replacing the TC paste,
but don't be surprised if that doesn't help much.
The reliance on PROCHOT is often a part of the thermal design.
Regarding fanless PC's proper, for industrial/embedded use... don't get me started. I get easily triggered by this topic. More than a single skeleton in this closet :-)
Intel 64 and IA-32 Architectures Software Developerĺs Manual ( one big PDF )
See especially Volume 3B, Chapter 15: Power and Thermal Management
See also Volume 4 : Model Specific Registers
ACPI : Advanced Configuration and Power Interface Specification . See chapter 8 - with a loose follow-up in chapter 11 on thermal zones. ACPI as part of UEFI: Ch.8: Processor Configuration and Control
Windows Power Policies / Profiles
Daniele Cesarini, Robert Schoene : Intel Power Management & MSR_SAFE
Some C-state exit latencies are mentioned on page 40 (conservative values)
Artem Bityutskiy: C-state latency measurement infrastructure - presents a clever trick, that an i210 NIC can be used to produce timed interrupts, and how to arrange that in the drivers and scheduler. Unfortunately, no results are presented.
Another paper, claiming to have measured C-state exit latencies: Vincent Guittot: How to get realistic C-states latency and residency ? - unfortunately, not very detailed (what C-state was measured?)
Thomas Krenn wiki entry on Processor P-states and C-states
Taylor W. Kidd: Power Management States: P-States, C-States and Package C-States
Quote: "T-States are no longer relevant!"
My response: that's false. They are relevant.
A question at SuperUser.com on the curious repetitive messages in the Windows Event Log, saying that the speed of processor 0 in group 0 is being limited by system firmware
A thread at Stack Overflow, with some tips on how to get your hands on the performance counter for "CPU perfomance percentage" in power shell.
A topic at ServerFault, mentioning "snmptools" for Windows - a flexible SNMP subagent, with a taste for the Windows performance counters.
The current website of snmptools by Erwan Labalec
And there's another topic at SuperUser, hinting at some interesting "performance counters", as accessed via the perfmon GUI.
By: Frank Rysanek [ rysanek AT fccps DOT cz] in February 2022 - August 2023