Hack^W^W^W customize to suit your needs.
On my troubleshooter job, there are times when I need to collect a bunch of hand-picked SNMP OID's for a short while, to get my hands on some instant in time when things went "uh oh". A day or two worth of data, with maybe a 1-second periodicity, to squash a pesky bug, and then to move on.
There are a numer of advanced SNMP collection / storage / graphing
software packages, which take days or weeks to learn and to configure,
have a web front-end etc.
For the purpose at hand, they are typically bloated and unwieldy.
Don't get me started about time-series databases - a Ph.D. research
topic in its own right.
At the other end of the spectrum, there is a simple clickety applet
or two, for Win32, that can record a single OID, straight into
a simple graph, but do not store the data on disk or anything.
These are overly simple for my needs.
It is not my point to record the whole MIB tree.
Nor is it my goal to record a large number of hosts,
for indeterminate durations in time. No big data!
I just need a dozen OID's from a single host,
for maybe a day or two. Make it a week if you will,
but even two hours are often enough.
I don't need a round-robin database. I don't even need
precisely clock-synchronized polling: imprecise polling
period is okay, as long as I can get a semi-precise
timestamp on every sample.
And, a complete log file is more useful than automatic
round-robin post-aggregation / rotation. Also, the log should
be in some simple format: human readable and machine-processible.
Disk space costs peanuts. Thus, the choice is clear:
the CSV format is obvious to anyone.
The "scanner" (collector) scripts are written in Perl 5, and require the "SNMP" module = Perl bindings for libsnmp, as provided by the net-snmp.org project. In Debian, the package is called "libsnmp-perl". (Note: do not confuse this with Perl/CPAN Net::SNMP = a different project.)
In Debian, apparently you also need a package called "snmp-mibs-downloader", which populates the directory /usr/share/snmp/mibs/ for you, with a couple dozen generic MIB files.
For generic switches, routers, ADSL modems and many other
sorts of hardware, snmp-mibs-downloader provides a set of
generic / standard / RFC-based MIB files.
If your SNMP target hosts contain a proprietary
SNMP MIB tree, you should get a corresponding
vendor-specific MIB file.
E.g., in the downloadable tarball on this page, the example
script relies on having some Meinberg-specific MIB files
in /usr/share/snmp/mibs/meinberg/ . Look for that path
in scan_periodic.pl.
When copying the custom MIB files, you may want to rename
them a bit, e.g. to remove any suffixes - as typically
the MIB files are called just something_or_another-MIB
(without a dotted suffix).
As you start the script for the first time, watch for any
complaints from libsnmp - you may find some lint that needs
to get manually trimmed (in the MIB files).
Side note: in a particular install of Debian 9 (Perl 5.24.1), I've encountered a strange problem, where Perl would complain about "undefined symbol: usmAESPrivProtocol". That's exported by the libsnmp.so and is present on the affected system. Apparently the problem stemmed from the fact that I enabled the "backports" repo in /etc/apt/sources.list, and from the backports I got a slightly newer version of libsnmp-perl (SNMP.pm) with some unsolved dependency... I solved that by manually copying SNMP.pm and auto/SNMP/* from a "good" setup to the borken setup. This shouldn't happen on a clean Debian install.
Another requirement is "GNUplot" - the graphing tool. My "scanner-logger-grapher" package contains a few example GNUplot scripts or config files (those with .gnu extension) that take the time series data in .csv format and transform them into simple time-series graphs in PDF format.
There are some UNIX shell scripts (.sh) as wrappers around GNUplot and around the periodic scanner (to run it as a daemon). These are not strictly necessary.
The scripts were originally written in Linux, but might be easy to run in Windows too, if you can get Perl with libsnmp and GNUplot under Windows.
To browse MIB files, I tend to use the GUI-based snmpb or the text editor VIM with syntax highlighting on - it's got a profile for ASN.1 symbolic notation (i.e. MIB textual source code).
The package contains two "scanner" scripts, written in Perl:
The first one called scan_once.pl takes a single sample
(of all the OID's configured) and prints them, one OID per row,
in textual representation (taken from the MIB).
The second script called scan_periodic.pl
is a "periodic" scanner, taking a sample of all the OID's
roughly once per second, and storing the output in a CSV file,
one row per sample, including a full timestamp in the first column.
The scripts share two config files:
cfg_oids.pl contains a hostname
or IP address of the target and SNMP community,
cfg_target_host.pl cotains a list of SNMP variables,
one per row.
The config files are in Perl syntax: the common parameters
(first file) initializes a "hash" (key=>value map)
and the second one initializes an array (of references
to anonymous arrays...) -- just stick to the syntax
of brackets, commas and quotes and you'll be fine.
The scripts also contain a path to custom MIB files (see above).
The time-series output from the periodic "scanner", stored in a CSV file, can be piped directly into GNUplot. That, provided that you can write a GNUplot script (more like a config file).
While the output of GNUplot may seem simple and un-sexy,
it can provide more detail and flexibility
than your typical web-based SNMP über-collector monster.
You can customize the tick spacing, legend font size,
legend descriptive strings, ranges (min/max), all of that
per axis, you can have two scales vertically (one on the
left and another one on the right) sharing the time base,
you can have several "variables" (OID's, CSV columns)
share a common vertical scale etc.
Each time series "variable" can have its line
a different color, thickness and line style.
GNUplot is actually much more capable than this,
it can plot several other types of charts - but as we are
interested in time series, our chart should probably have
time on the horizontal axis.
The PDF output format is nice for several reasons:
it is a vector format, can be zoomed in pretty much
indefinitely, retaining maximum detail from the input data
- which can turn into a downside, if there are many thousand
samples in the time series - the display in reader will be slow.
PDF is also universally accepted, readers are available for
most OS platforms.
If the size of your input data makes PDF impractical,
try some bitmap/raster format for your output, such as the .PNG.
The fastest way to find out how to modify the example GNUplot scripts = what keywords to use and what the syntax is, is using Google to search for other people's examples. That combined with GNUplot's reference manual (and full-text keyword search in that).
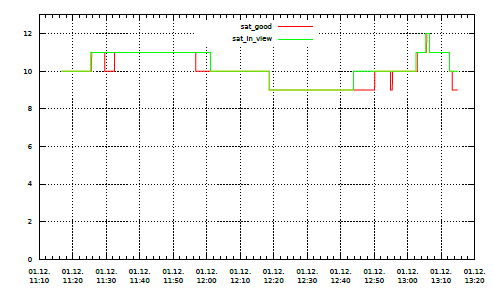
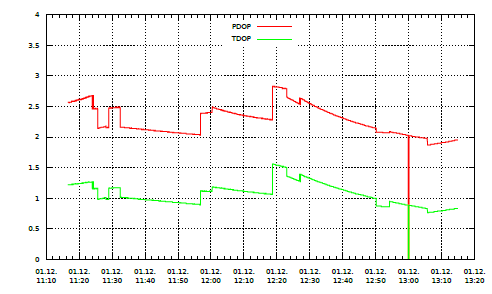
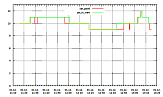
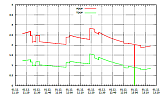
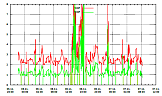
The graphs were generated using the enclosed scripts.
Specifically for the DOP values it may be necessary to modify
the yrange in the GNUplot script, depending on if you want
to see the actual insane maxima (especially with suboptimal
antenna placement), or you are more interested in the
"sane region".
Similarly, you can
limit the window in time
that gets displayed in the plot, using the xrange keyword and a special
format for date and time in the range definition.