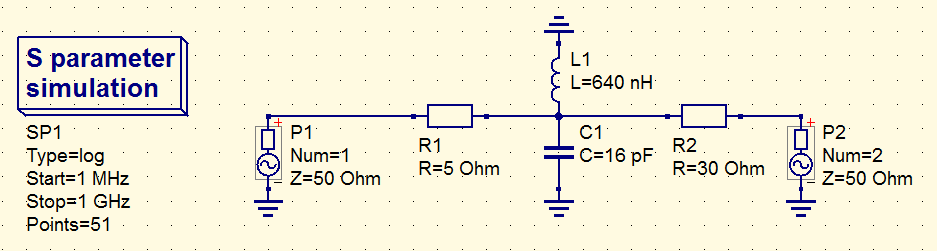
Schematic with a higher impedance resonator (lower Q)
I'm not an EE graduate, but practical electronics has always been my hobby (albeit typically on the back burner) and I also happen to wade into antenna and RF technology on my job every now and then. On a recent encounter with WiFi antennas and directional couplers, as I was simulating some stuff in Qucs, I came across the S-parameters and the Smith chart (once again). I got intrigued, because this stuff seemd related to my "research into directional couplers". (Well... not all that useful, as I later concluded, but anyway.)
I felt I had to "start from someplace in the middle", as I didn't
have enough of a maths background to start "properly from the ground up".
I started out by spending some time reading primers on the
S-parameters
and the
Smith chart
(kudos to Microwaves101.com):
what variables are on each axis, why the grid is curved,
the distinction between the impedance vs. admittance version of the
Smith chart. I was wondering what some typical circuits looked like
in the Smith chart - and the interwebs provided surprisingly few
answers. That's when I started to squint back at Qucs:
"Oh wait... I can sketch some circuits in Qucs. And, Qucs contains
some Smith charts in the graphing tabs. Now how do I go about this,
does it actually work? I could then try fiddling with some
component values to see the effect of my changes..."
The current version of Qucs (0.0.19 RC as of this writing) turns out to be an excellent educational toy when it comes to S-parameters and the Smith chart.
Essentially, you need a "power source" for each port of your circuit. This component looks like a voltage source with a series resistor in one package. Next, you need an "S-parameter simulation". This will automatically set up the matrix of N by N ports. Once you compute the simulation, in the graphing tab you can select the two versions of the Smith chart, or a "cartesian" Bode plot. You will be offered the S-matrix members for use in your charts/plots.
The following is an LC circuit, coupled by two different
series resistors to two different power sources.
Note the resulting shape on the Smith chart, the differences
and similarities between the impedance and admittance version
of the Smith chart, and the differences vs. similarities
among the various S-parameters.
I've taken screenshots of two, slightly different versions
of the schematic: the difference is in the L and C values,
both versions resonate at 50 MHz, but each one with a different Q.
Note how this affects the shape of the Bode plot and the
"spacing of nodes" in the Smith chart :-)
Schematic with a higher impedance resonator (lower Q)
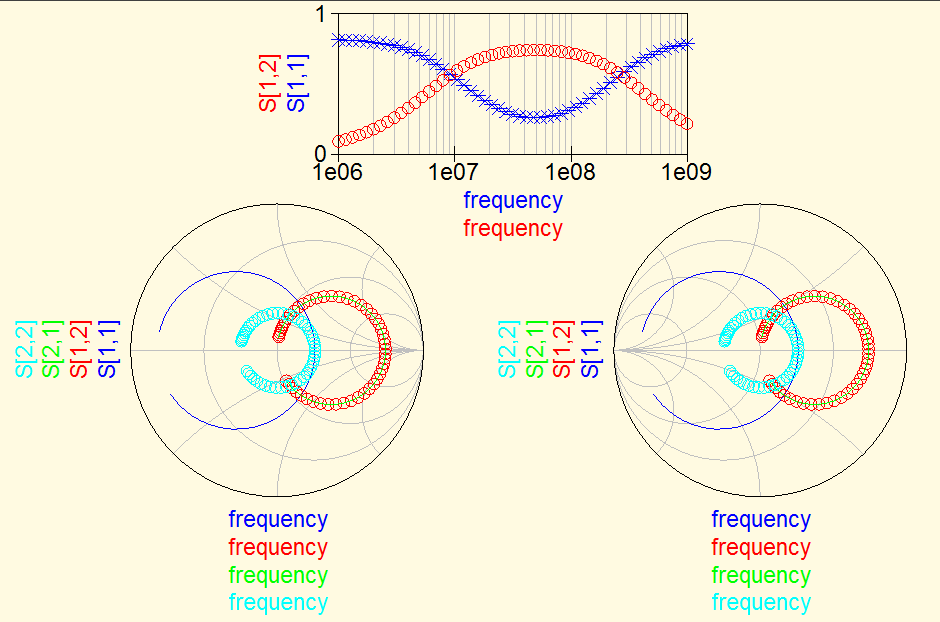
Charts with a higher impedance resonator (lower Q)
Impedance chart on the left, admittance chart on the right
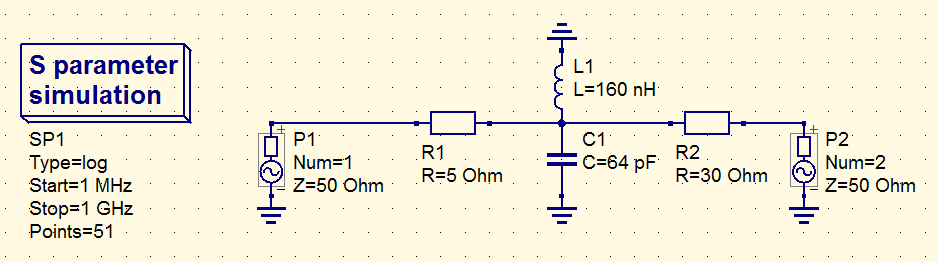
Schematic with a lower impedance resonator (higher Q)
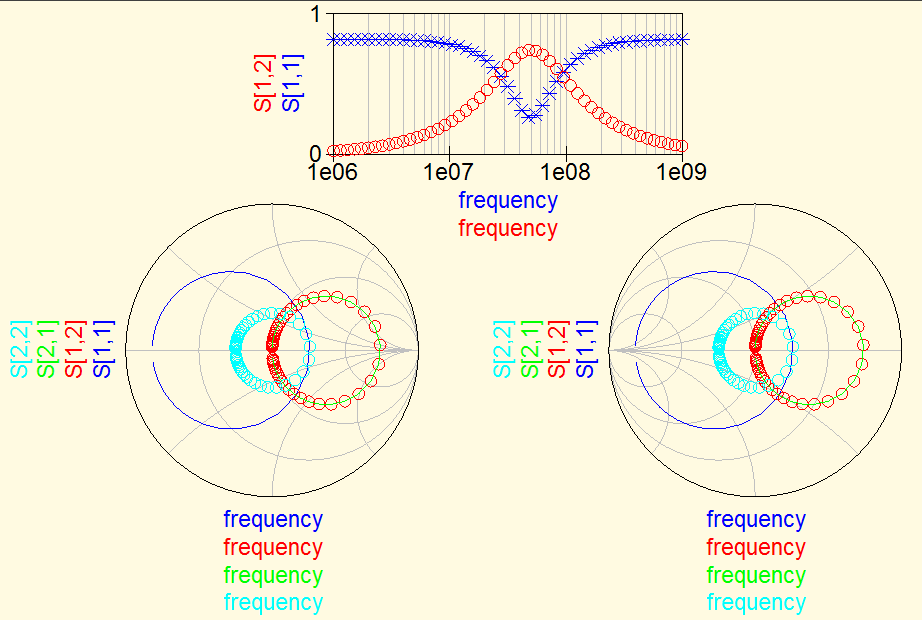
Charts with a lower impedance resonator (higher Q)
Impedance chart on the left, admittance chart on the right
Note: speaking of Q, this is affected by the resistors
in the schematic. The resonant cell itself consists of ideal L and C,
but the resistance from the signal sources (and also the one intrinsic
to the signal sources) plays a role in the Q.
Try playing with the values yourselfs (data download follows below).
I have an itching to summarize, in lay man terms, some of the
stuff I've gleaned from all the tutorials I've read.
Stuff that has some practical use, without you knowing all the
background maths by heart. As a consequence, some of my
statements below are likely incorrect :-) or need to be
further qualified by conditions.
Use with a grain of salt.
My experiments in Qucs have resulted in some trivial example circuits and simulations = a Qucs project directory containing some ready files. Have them :-) and use them as a basis for your own tweaks/experiments.
Qucs project homepage
Wikipedia on Admittance (and its relationship to Impedance)
Microwaves101 on the Smith chart, including a "nomogram trick" to calculate a matching compensation TML stub
Wikipedia's Smith chart (a beautiful vector image in SVG format)
By: Frank Rysanek [ rysanek AT fccps DOT cz ] in January 2017